How can I analyze my data for company management and management control?
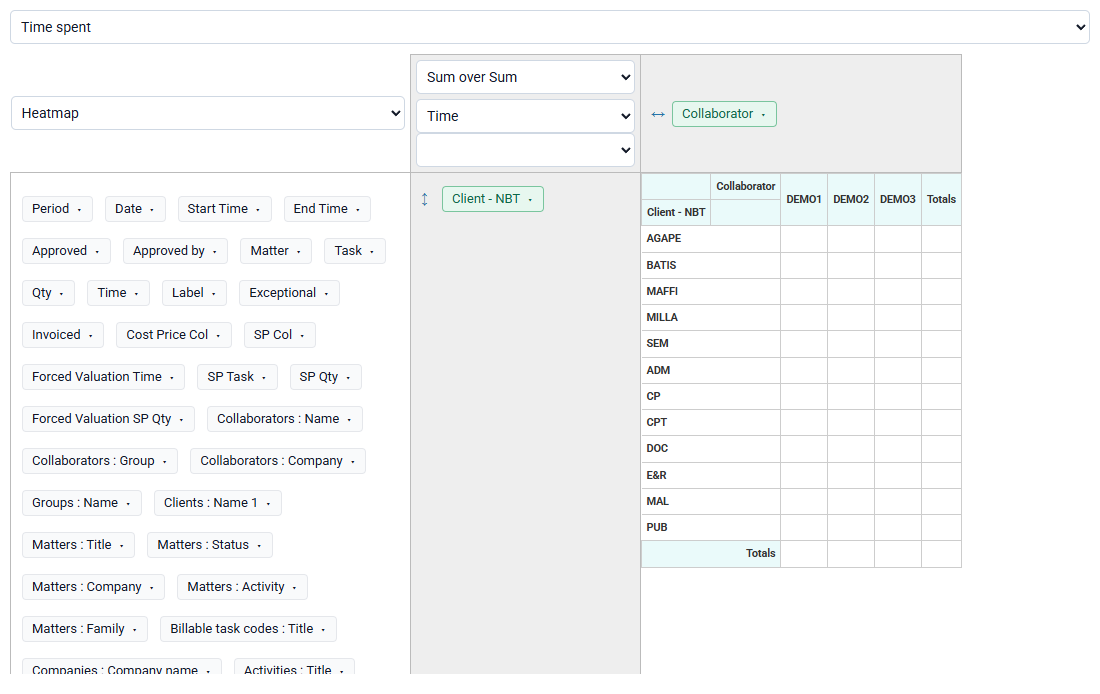
Tempolia offers many analysis options to manage your activity. You can create pivot tables or go to « Tools > Reports / printouts ». In particular, you can use the following approaches:
- By client and by matter: summary or detailed reports, limited to actual work or compared with forecasts, etc.
- By employee or group: analysis of time spent, activity control, internal services, etc.
- By task type: time performed by task, average rate applied, etc.
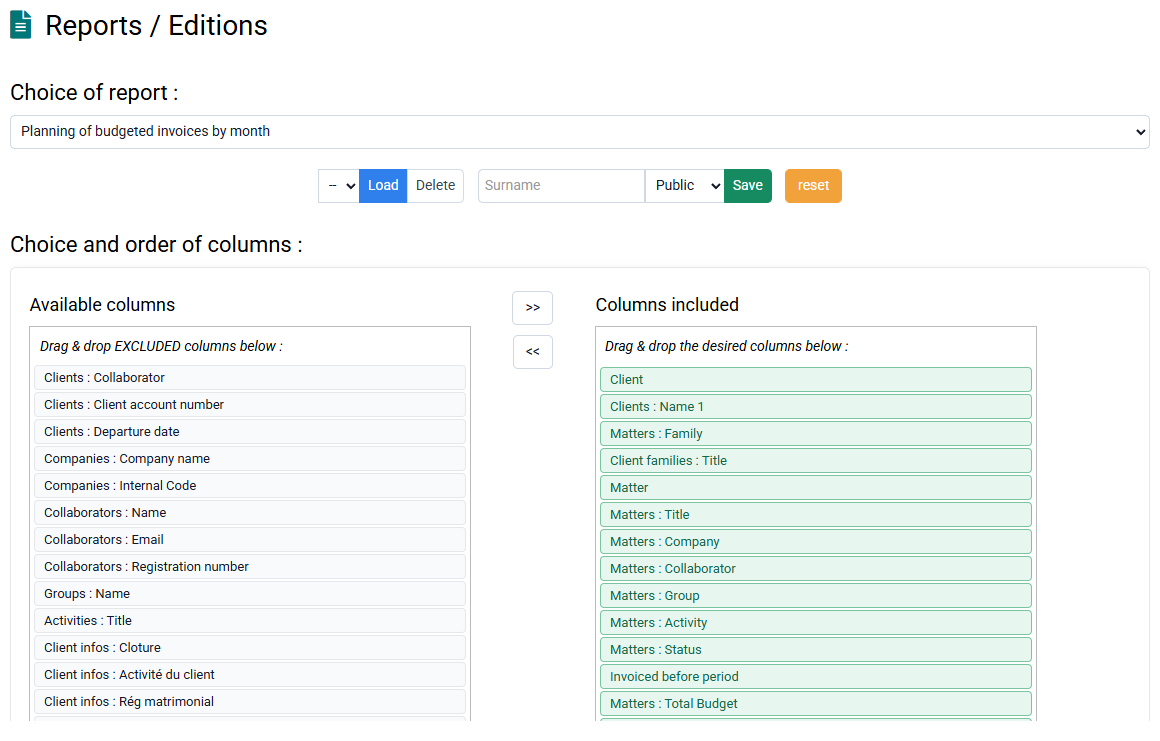
- By month: monthly distribution of employee work, billing budgets, revenue, etc.
- Detailed: pre-billing report with exceptional time to invoice, details of services performed for a client to analyze bonus / loss, etc.
All reports are customizable, exportable to Excel or displayable in your browser, with the columns of your choice. You can therefore print to PDF with a zoom level adapted to the number of selected columns.