How do I create a pivot table for management control?
Tempolia’s « Tools > Pivot tables » feature lets you investigate data freely and interactively in real time, like the pivot tables found in Excel. It is ideal for management control and investigations outside standard reports. You can quickly transform raw data into clear, usable multidimensional analyses without leaving the software.
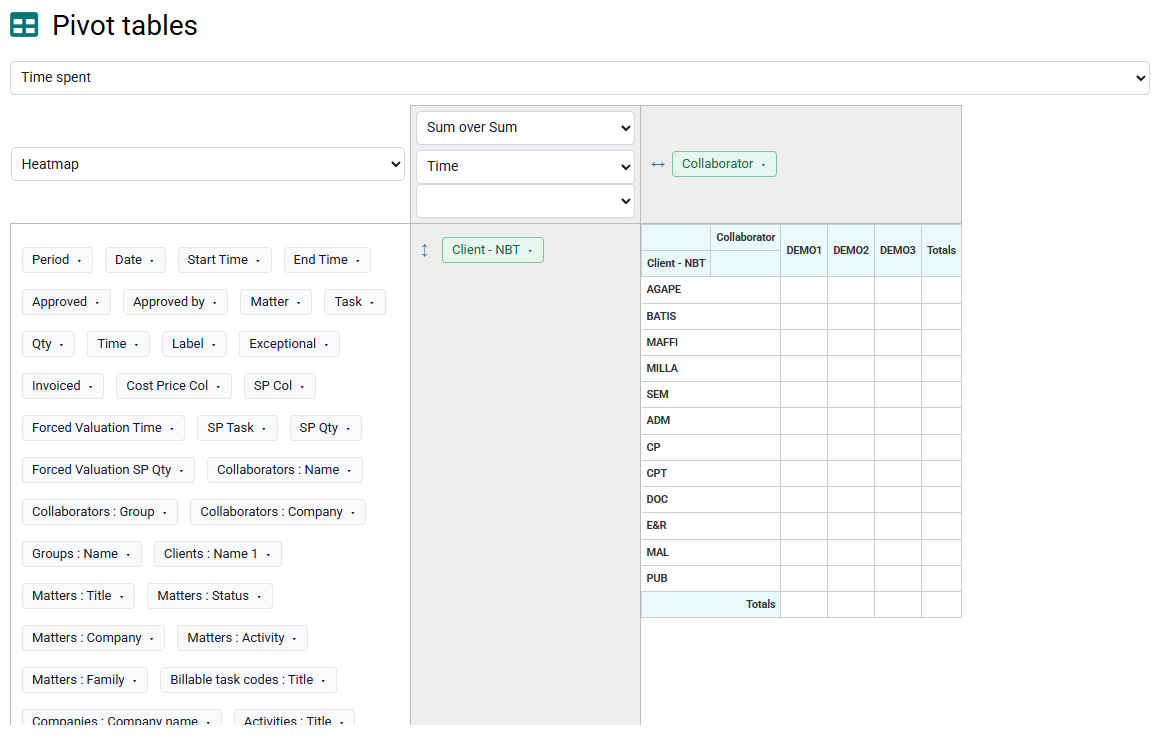
You start by choosing a data source, such as time spent or budgets. You can then work with the data by drag and drop, organizing your analysis by placing the desired fields, clients, matters, employees, tasks, and so on, in rows or columns to create customized views.
This flexibility lets you build real-time custom analyses. You can also choose the value displayed at the intersection of rows and columns: it may be the sum of time, its valuation, sales price, or the cost price. The system automatically calculates totals by row and by column, giving an immediate summary.
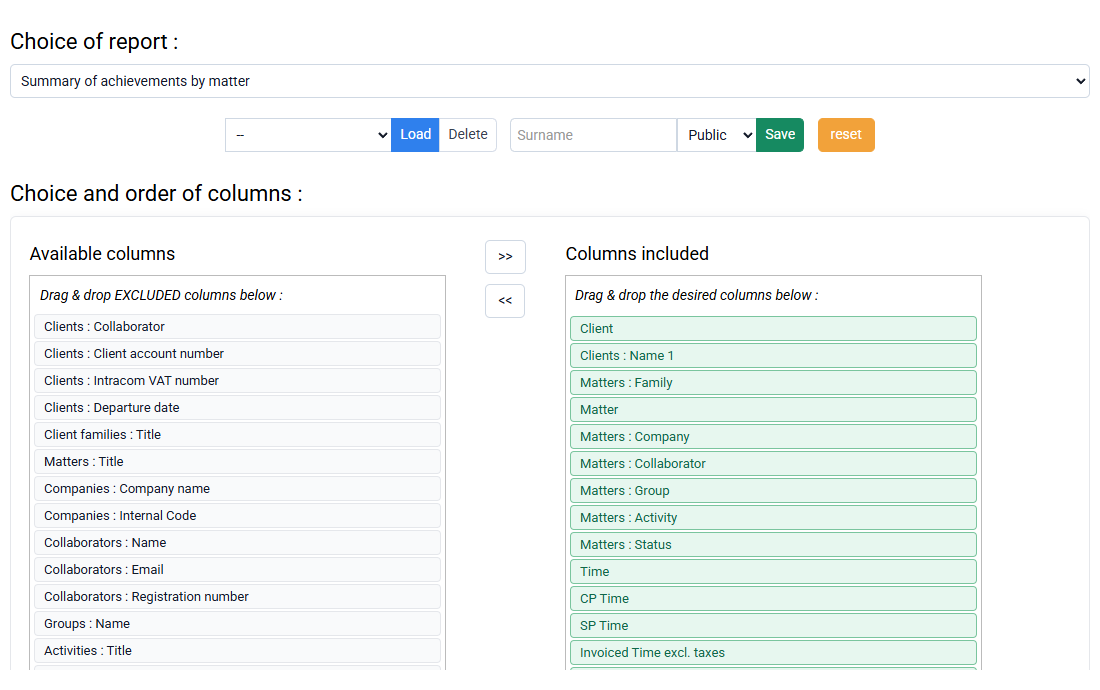
Filters can be applied to refine the results and keep only relevant information. Once you have created a suitable analysis view, you can save this configuration for later reuse, making regular monitoring easier.
Finally, for more advanced processing or to share results, you can export the generated table very easily to Excel: click "Heat map" on the left of the table to change the visualization to "CSV to paste into Excel", then select the data table and paste it into Excel to manipulate and optionally save the data.